This page gives you the short version of Knitting’s benchmark results across
Node, Deno, Bun, and Tokio.
The tests focus on worker communication, payload sizes, batching, and
CPU-heavy work. Use them to compare workloads and transport costs. Your application’s
performance will depend on its own workload and environment.
The Node, Deno, and Bun figures come from Knitting 0.1.24 on an Apple M3 Ultra,
recorded in March 2026. The Tokio comparison is a separate run on different
hardware, described on its own page.
Batching improves throughput, especially as the number of calls grows.
Large binary payloads are mainly limited by copying and memory bandwidth.
CPU-heavy work scales across workers, but the result depends on the runtime
and the number of threads.
When the charts say one option is “faster,” that only applies to the test shown:
the payload, batching, runtime, and amount of work all matter.
Tokio close-up
Primitive handoffs, copy-heavy bytes, and a separate Arc reference
This close-up mixes two kinds of communication cost: primitive handoff slices and one
copy-heavy Uint8Array slice from the fairer default tables. The
Arc<Vec<u8>> card is separate and should be read as a Tokio shared-ownership
reference, not as the default apples-to-apples byte comparison. Markers to the left are
faster, markers to the right are slower.
Highlighted cases: f64, copied Uint8Array, Arc referenceScope: communication cost, not end-to-end throughputMetric: average latency, lower is better
number f64 · batch 1
Primitive handoff only: Node and Bun are faster, Tokio stays ahead of Deno, and all four remain in the 6-22 µs range.
0.5x1.0x Tokio1.8x
T
B
N
D
Tokio13.01 µsbaseline
Bun + Knitting7.35 µs44% faster
Node + Knitting6.63 µs49% faster
Deno + Knitting21.54 µs66% slower
number f64 · batch 10
Still a handoff-cost slice: Bun, Node, and Deno stay below 20 µs, while Tokio averages 27.50 µs.
0.5x1.0x Tokio1.8x
T
B
N
D
Tokio27.50 µsbaseline
Bun + Knitting13.41 µs51% faster
Node + Knitting17.28 µs37% faster
Deno + Knitting11.97 µs56% faster
Uint8Array 512 KiB · batch 100
This is the copy/clone-heavy byte path: Bun and Node edge Tokio on average, while Deno is a bit slower and all four land in the same 22-25 ms band.
0.5x1.0x Tokio1.8x
T
B
N
D
Tokio23.06 msbaseline
Bun + Knitting22.33 ms3% faster
Node + Knitting22.66 ms2% faster
Deno + Knitting25.26 ms10% slower
Arc<Vec<u8>> ref · 512 B · batch 100
Separate Tokio shared-ownership reference, not the default byte benchmark: Bun stays within 6% of Tokio, while Node and Deno are slower.
0.5x1.0x Tokio1.8x
T
B
N
D
Tokio79.51 µsbaseline
Bun + Knitting74.78 µs6% faster
Node + Knitting97.23 µs22% slower
Deno + Knitting123.11 µs55% slower
Primitive and copied-byte rows come from the fairer default comparison. The Arc row is
included as a separate small-payload shared-ownership reference.
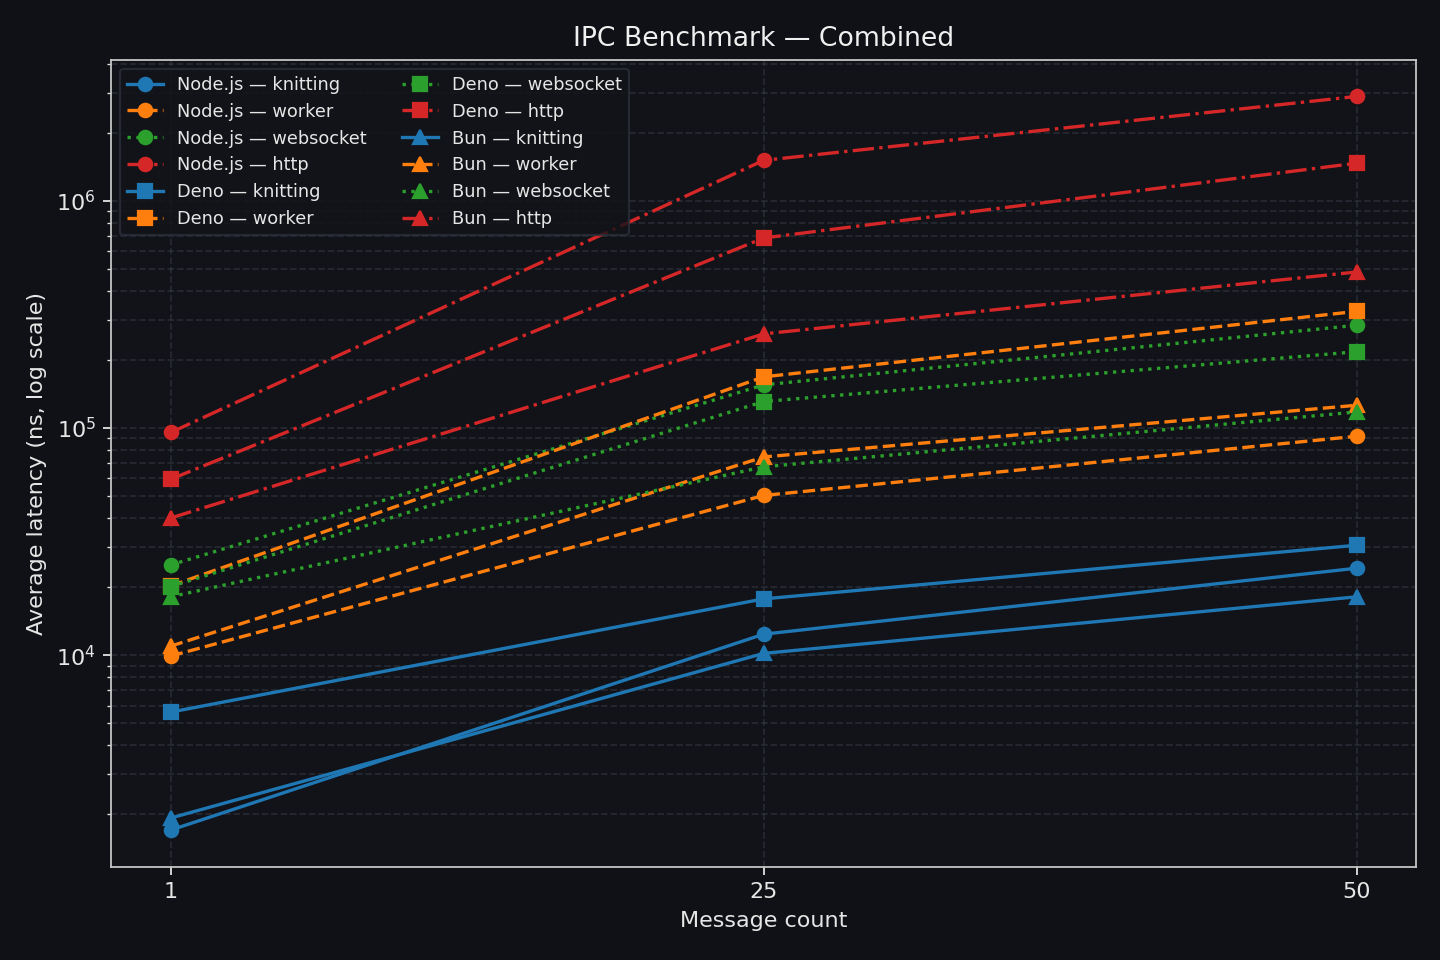
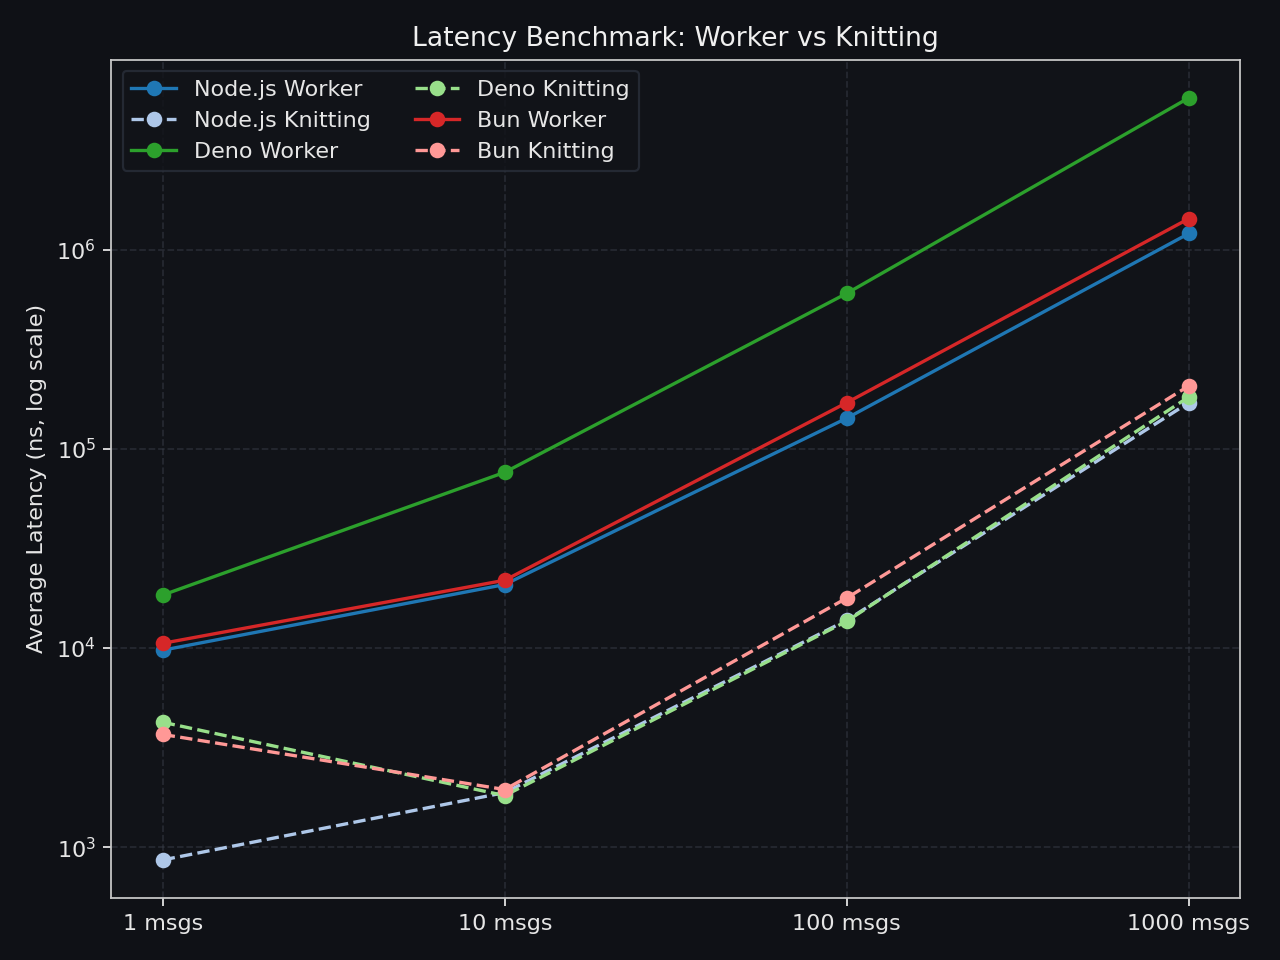
This chart shows what happens as each test sends more messages at a time.
Knitting is generally around 3–45× faster than the worker baselines in these
runs. The advantage is clearest in small and medium batches, where communication
overhead makes up more of the total time.
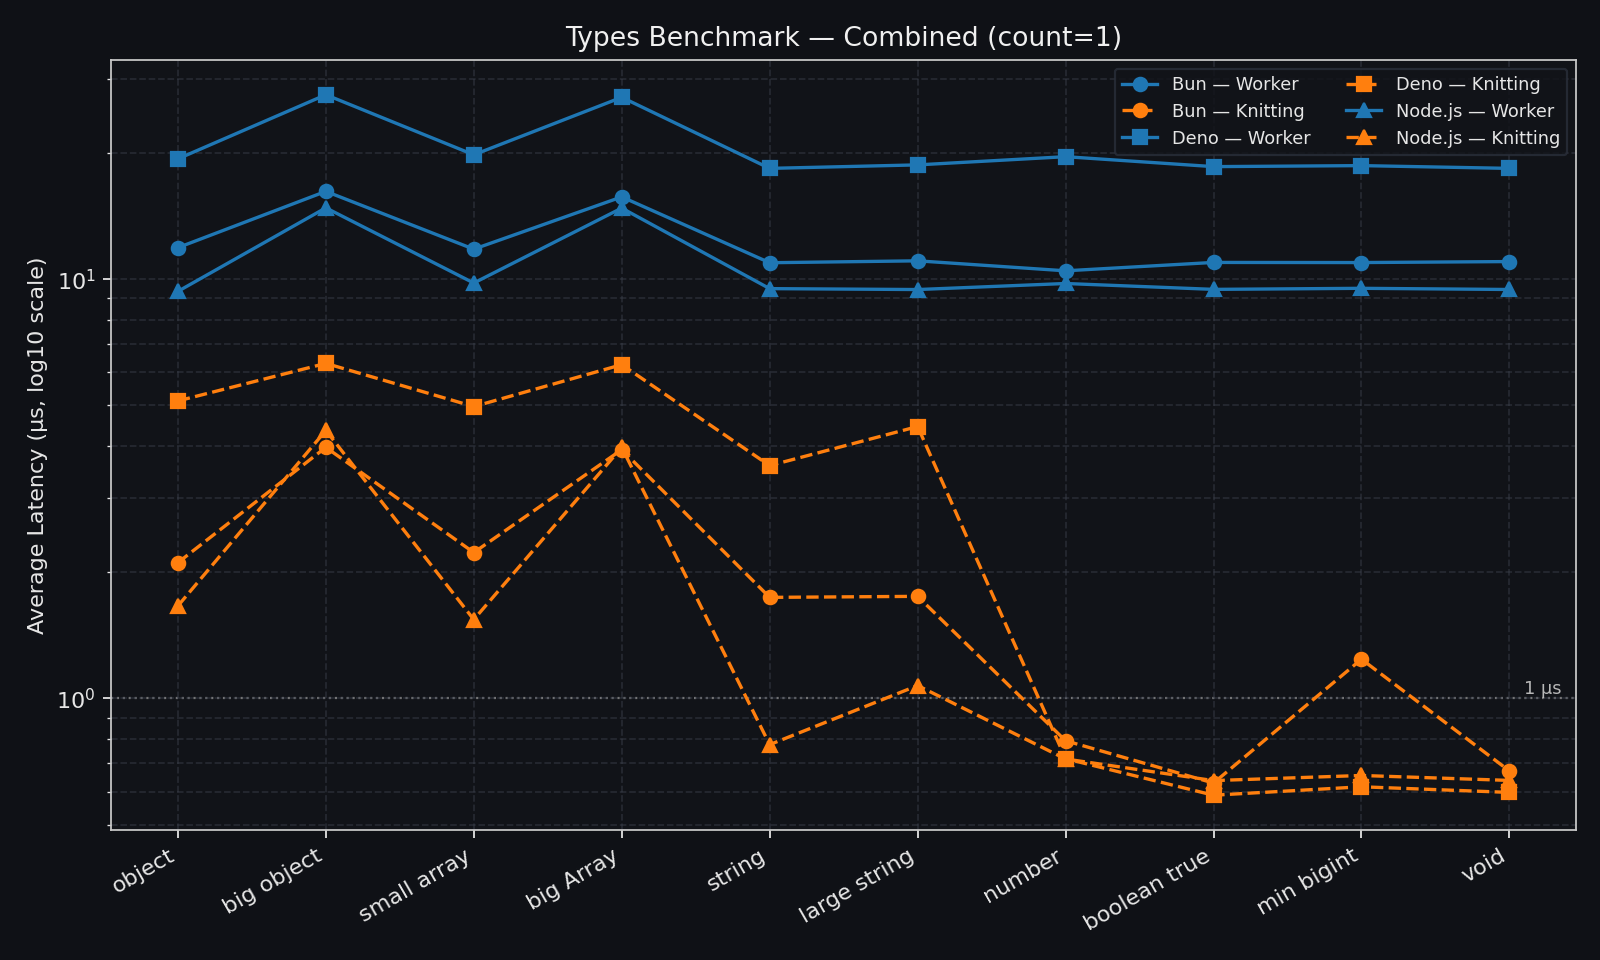
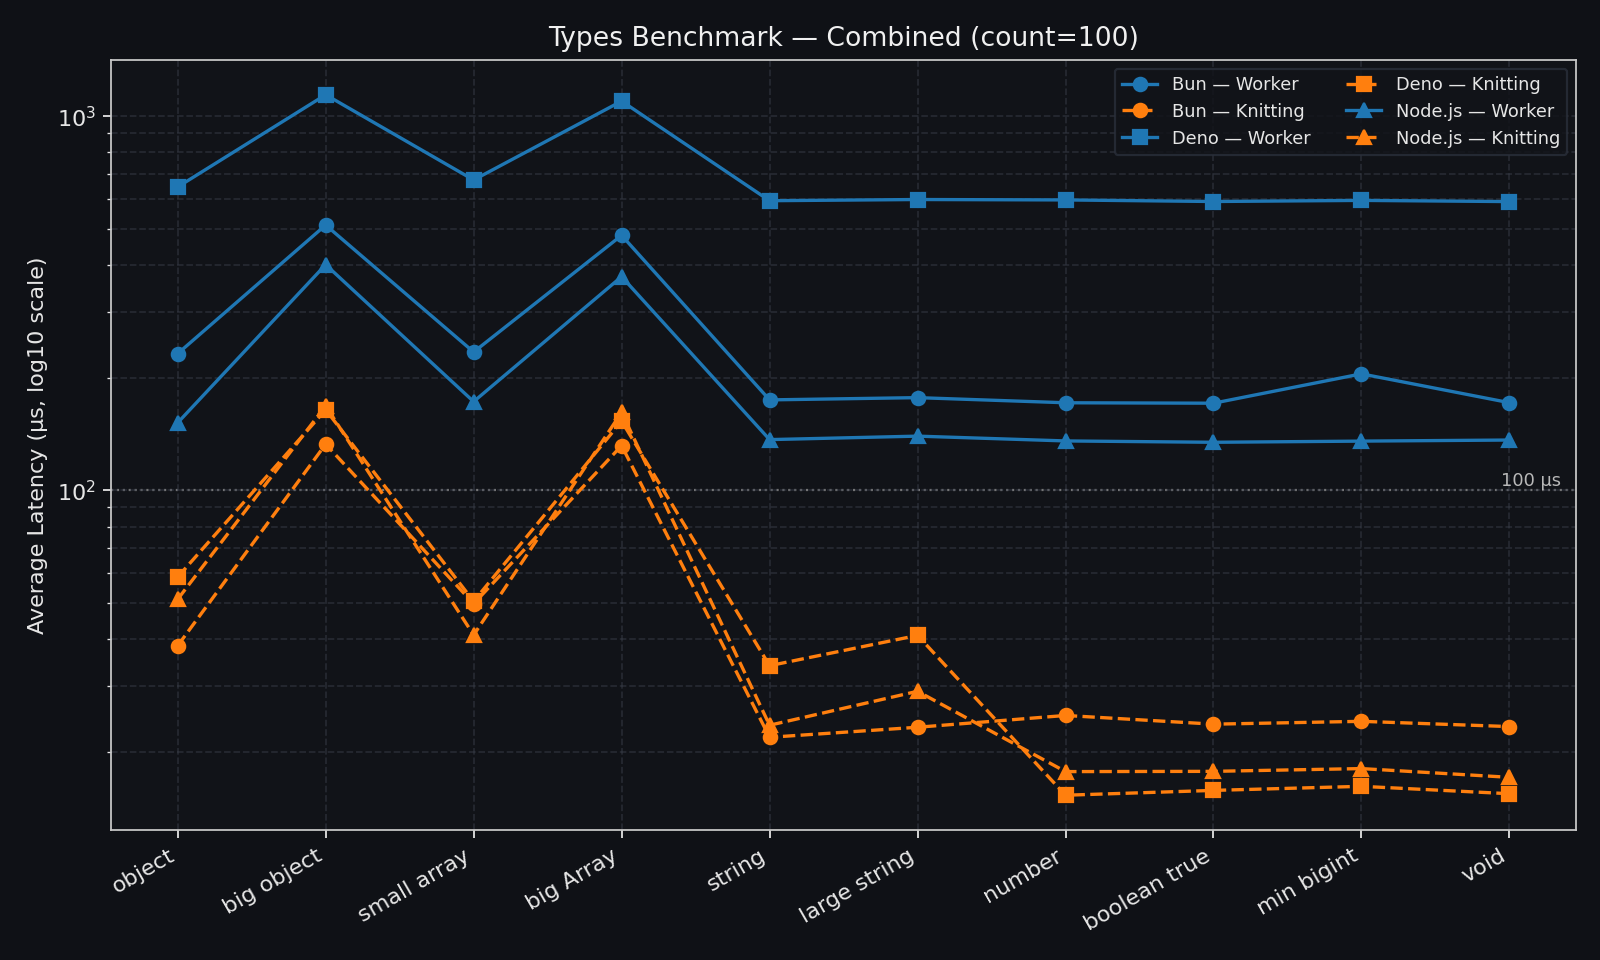
These charts compare one value at a time with batches of 100 values.
Structured and binary values cost more than primitives, and large objects and
errors cost more again. Batching improves throughput while keeping Knitting’s
relative advantage in these tests.
These are one-way transfer results for a 1 MiB payload with a batch size of
64:
Runtime
String (GB/s)
Uint8Array (GB/s)
Node
1.44
7.50
Deno
3.37
5.78
Bun
11.86
16.21
Bun is fastest in this particular 1 MiB test for both strings and binary data.
At this size, memory bandwidth and runtime details matter as much as the worker
coordination itself.
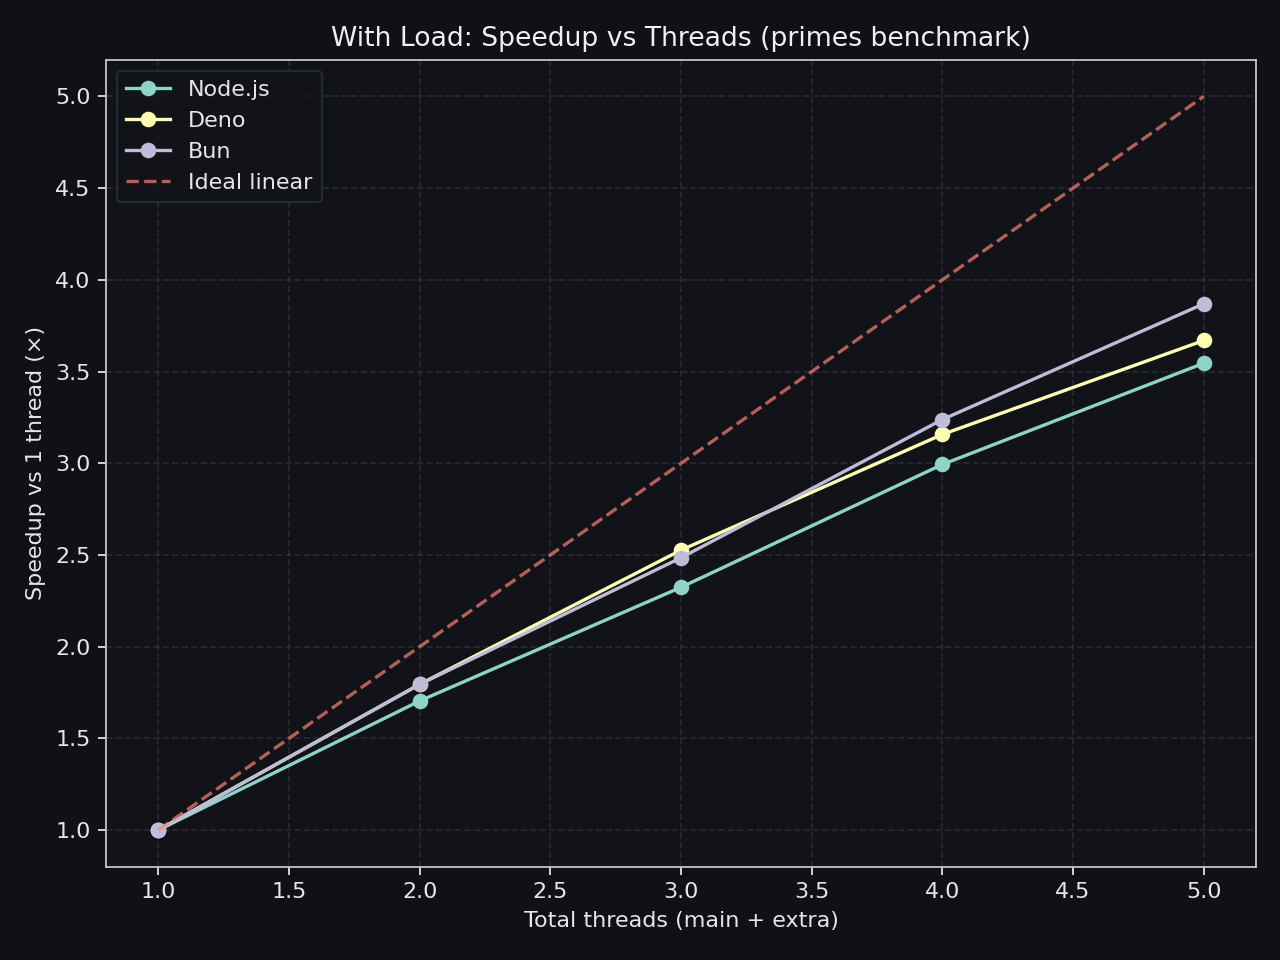
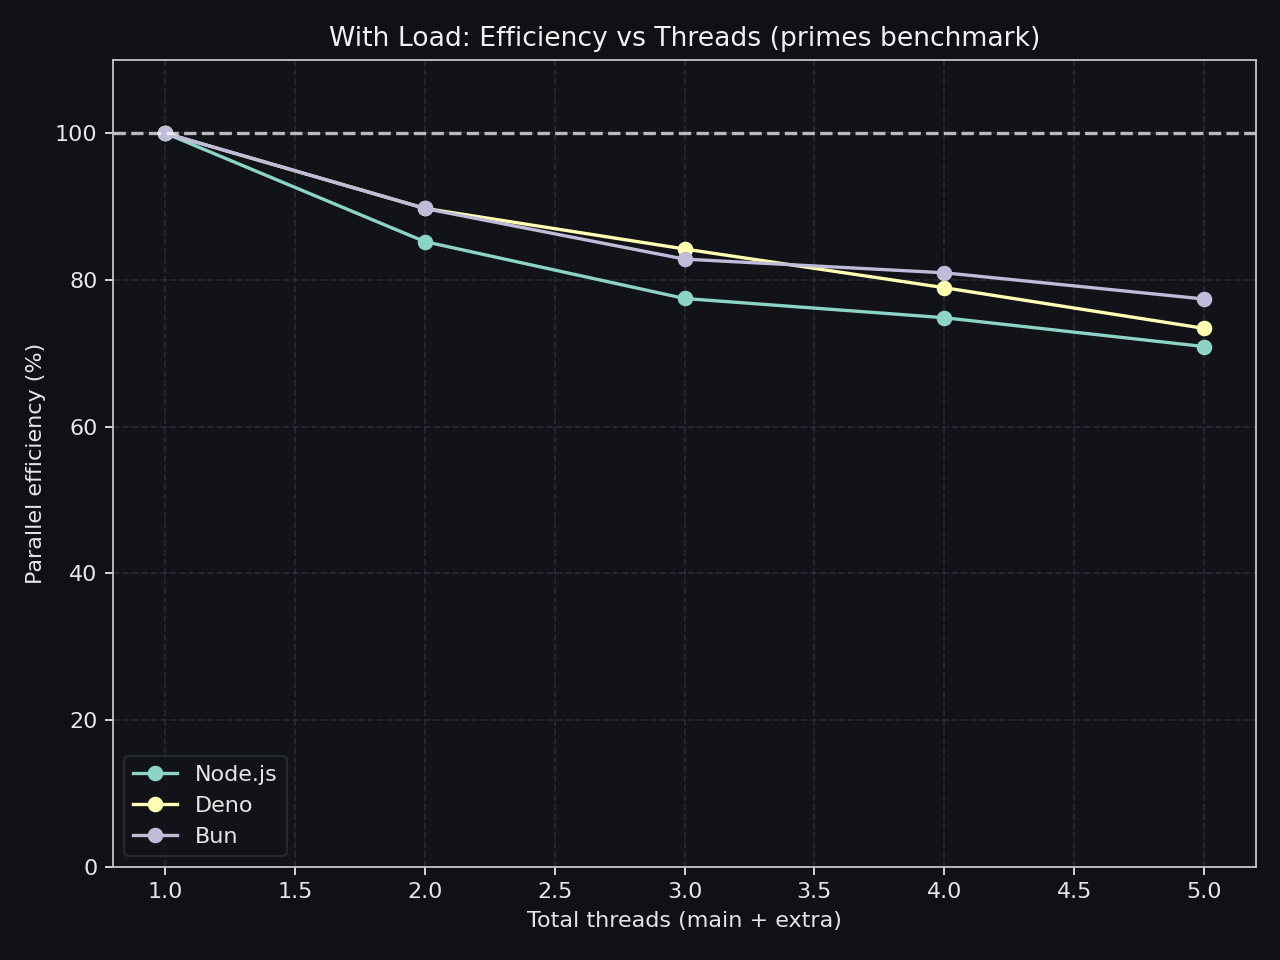
This test distributes a CPU-intensive prime-number workload across extra
threads. In these runs, speedup reaches roughly 3.5–3.8× with four extra
threads, while efficiency stays around 70–77%.
That does not mean every application will scale the same way. I/O-heavy work
usually behaves very differently.